Police Killings in the U.S.: Who Is Most Affected by Police Violence
Police encounters can escalate quickly, and when they do, the consequences are often permanent. Across the United States, hundreds of people are killed by police each year, raising ongoing questions about how force is used, who is most affected, and whether these incidents are evenly distributed.
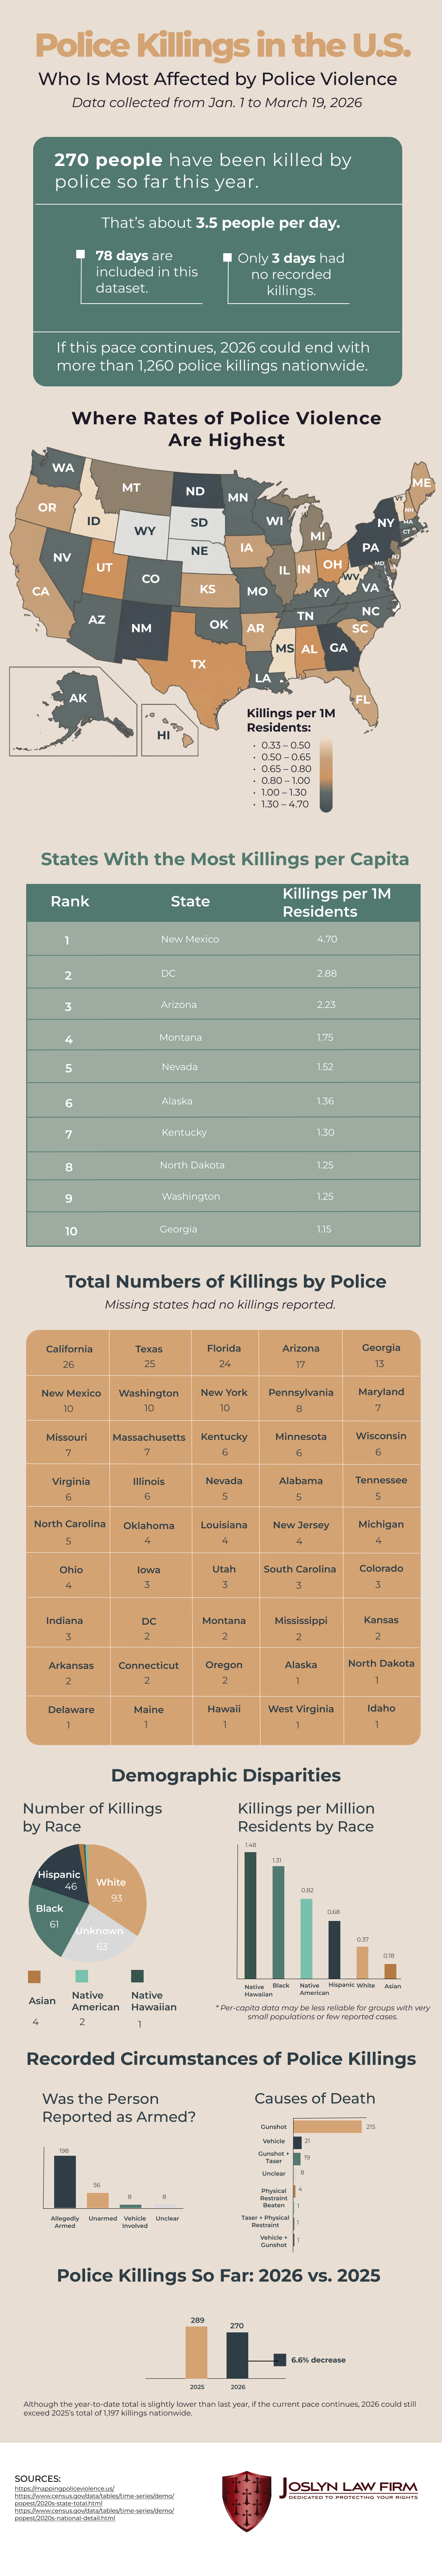
Using data from Mapping Police Violence and population estimates from the U.S. Census Bureau, the Joslyn Law Firm team put together an examination of police killings recorded between Jan. 1 and March 19, 2026, in order to get a clearer picture of who’s been affected by police violence the most.
Click to view the full-size infographic
2026’s Trend Paints a Grim Picture
Between Jan. 1 and March 19, 2026, 270 people were killed by police. That amounts to roughly 3.5 deaths per day over a 78-day period.
These incidents are not rare or isolated. Only three days during this timeframe passed without a reported killing.
At the current pace, the total number of police killings in 2026 could exceed 1,260 by the end of the year. That projection places this year on track to match or surpass recent annual totals.
Police Use-of-Force Standards Differ Across Jurisdictions
Although police officers across the United States operate under constitutional standards governing the use of force, the policies, training procedures, and enforcement practices used by individual departments can vary significantly from one jurisdiction to another. As a result, the circumstances surrounding police encounters — and how force is evaluated afterward — are not always handled uniformly across states or agencies.
Under the Fourth Amendment, courts generally evaluate police use of force using an “objective reasonableness” standard that considers the facts and circumstances confronting officers at the time of an encounter. In many situations, these incidents unfold rapidly and involve split-second decisions made during high-pressure interactions involving suspected criminal activity, weapons allegations, or perceived threats to officer safety.
Several factors may influence how police encounters escalate and how force is later reviewed:
- Departmental use-of-force policies and officer training standards
- State laws governing police conduct and officer accountability
- The presence of alleged weapons, violent conduct, or perceived threats during an encounter
- The availability of body-camera footage, witness statements, and forensic evidence
- Whether investigators believe the level of force used was legally justified under the circumstances
Because policing standards, investigative procedures, and departmental policies differ across jurisdictions, incidents involving police use of force can raise complex legal and constitutional questions that are often evaluated differently depending on the facts of the encounter.
Where Rates of Killings by Police Are Highest
Looking at raw numbers alone can be misleading. Larger states will almost always report more total incidents simply because they have more people. Per-capita rates provide a clearer picture by showing how often these incidents occur relative to population size.
The highest rates were recorded in:
- New Mexico: 4.70 per 1 million residents
- Washington, D.C.: 2.88 per 1 million residents
- Arizona: 2.23 per 1 million residents
- Montana: 1.75 per 1 million residents
- Nevada: 1.52 per 1 million residents
- Alaska: 1.36 per 1 million residents
- Kentucky: 1.30 per 1 million residents
- North Dakota: 1.25 per 1 million residents
- Washington: 1.25 per 1 million residents
- Georgia: 1.15 per 1 million residents
These figures show that higher rates are not limited to any one region. In some cases, smaller states rank near the top because even a modest number of incidents results in a higher rate per resident.
Why Population Size Alone Does Not Explain Police Violence Trends
Raw totals can help illustrate the overall scale of police killings nationwide, but they do not always provide a complete picture of how frequently these encounters occur relative to population size, policing practices, or law enforcement activity within a particular area. States with larger populations will naturally report higher numbers of police encounters overall, which can influence the total number of reported incidents involving deadly force.
At the same time, states with smaller populations may experience disproportionately high per-capita rates even when the total number of incidents appears lower. Differences in policing environments, population density, crime rates, and law enforcement activity can all affect how often officers encounter potentially dangerous or high-pressure situations.
Several factors may contribute to variations between states:
- Population size and the total number of police-citizen encounters occurring within a jurisdiction
- Urban versus rural policing environments and differences in response demands
- Variations in crime rates, violent-crime investigations, and emergency-response activity
- Differences in departmental training, staffing levels, and tactical procedures
- State and local policies governing use-of-force reporting and investigative review
Because these incidents occur under widely different circumstances across the country, both total numbers and per-capita rates are important when evaluating broader patterns involving police violence and law enforcement encounters.
Where Total Numbers of Police Killings Are Highest
Total numbers still matter. They reflect the overall scale of the issue and where the greatest number of lives are being lost. The highest totals so far in 2026 were:
- California: 26
- Texas: 25
- Florida: 24
- Arizona: 17
- Georgia: 13
Other states, including New Mexico, Washington, and New York, each reported 10 killings during this period. Several additional states reported between four and eight incidents, while others reported only one or two.
Even in states with lower totals, these incidents continue to occur, reinforcing that police killings are a nationwide issue rather than one limited to a handful of locations.
Many Police Encounters Begin With Other Alleged Offenses
Many incidents involving police use of force begin as responses to other reported criminal or public-safety concerns. In many cases, officers are initially responding to situations involving alleged weapons offenses, suspected drug activity, domestic disturbances, traffic violations, mental health crises, or active emergency calls before an encounter escalates further.
Because these interactions often develop quickly and under stressful conditions, even routine encounters can become unpredictable depending on the circumstances confronting officers and civilians at the scene. Investigators reviewing these incidents may later examine not only the force used during the encounter itself, but also the events leading up to the initial police contact.
Police encounters that later involve force frequently begin with situations such as:
- Traffic stops involving alleged moving violations, impaired driving, or outstanding warrants
- Responses to reported domestic disputes, assaults, or violent disturbances
- Investigations involving suspected drug possession, weapons offenses, or other criminal allegations
- Mental health or welfare-check calls involving individuals in distress
- Attempts to detain, question, or arrest individuals during rapidly evolving situations
In many jurisdictions, investigators reviewing police killings may evaluate factors such as officer decision-making, perceived threats, attempts at de-escalation, witness statements, body-camera footage, and whether law enforcement actions complied with departmental policies and constitutional standards governing the use of force.
Demographic Disparities in Killings by Police
The data also highlights differences in how police violence affects different groups.
By total count, the largest number of individuals killed were identified as white (93). Black (61) and Hispanic (46) individuals make up a significant share of the remaining cases, along with 63 cases where race was not recorded. Smaller totals were reported for Asian (4), Native American (2), and Native Hawaiian (1) individuals.
However, population-adjusted rates tell a different story.
When measured per 1 million residents, the highest rates were:
- Native Hawaiian: 1.48
- Black: 1.31
- Native American: 0.82
- Hispanic: 0.68
- White: 0.37
- Asian: 0.18
These differences show that certain groups face a higher likelihood of being affected, even when their total numbers are smaller. Note, however, that per-capita figures for smaller populations (such as Native Hawaiians in this data) can be easily skewed and should be interpreted with caution.
Reported Circumstances May Not Capture Every Detail of an Encounter
Early reports involving police killings often provide only limited information about how an encounter unfolded. In many cases, the details initially released to the public may later change as investigators review body-camera footage, forensic evidence, witness statements, dispatch records, and other materials connected to the incident.
Because these investigations can take weeks or months to complete, early reporting may not fully capture the legal, factual, or procedural issues surrounding a police encounter. Conflicting witness accounts, incomplete evidence, or evolving investigative findings can all affect how an incident is ultimately interpreted by investigators, prosecutors, or the public.
Several factors may complicate the reporting and review process following a police killing:
- Witness statements and officer accounts may conflict regarding how an encounter unfolded
- Body-camera footage, surveillance video, or forensic evidence may not become publicly available immediately
- Toxicology reports, autopsy findings, and investigative records may take time to complete
- Law enforcement agencies may release limited information during active investigations
- Investigators often evaluate whether officers complied with departmental policies and constitutional standards governing the use of force
Because these cases frequently involve complex factual and legal questions, publicly available information may evolve substantially as investigations progress and additional evidence becomes available.
Circumstances Surrounding Police Violence
The data also provides insight into how these encounters unfold, including whether individuals were reported as armed and how their deaths occurred.
In terms of reported armed status:
- 198 individuals were listed as allegedly armed
- 56 were unarmed
- 8 cases involved a vehicle that could have been used as a weapon
- 8 were unclear
The most common reported causes of death were:
- Gunshot: 215
- Vehicle-related: 21
- Gunshot combined with Taser: 19
- Physical restraint: 4
These figures rely on available reporting and may not fully capture the context of each encounter. However, they provide a general picture of how force is most often applied.
Officer-Involved Killings Often Trigger Multiple Investigations
Incidents involving police use of deadly force are often reviewed through multiple investigative processes simultaneously. Depending on the jurisdiction and circumstances surrounding the encounter, a police killing may trigger internal departmental reviews, criminal investigations, administrative inquiries, or independent oversight evaluations conducted by outside agencies.
In many jurisdictions, investigators are tasked with determining not only how an encounter unfolded, but also whether officers complied with departmental procedures, constitutional standards, and state laws governing the use of force. These investigations may involve prosecutors, forensic specialists, internal affairs divisions, civilian oversight agencies, or state and federal authorities.
Following an officer-involved killing, investigators may review:
- Body-camera footage, surveillance video, dispatch records, and witness statements
- Whether officers complied with departmental use-of-force policies and training standards
- Forensic evidence, autopsy findings, and ballistic analysis connected to the encounter
- Whether the force used was considered legally justified under the circumstances
- Potential criminal, administrative, or civil-rights implications arising from the incident
Because these investigations often involve multiple agencies and legal standards, reviews surrounding police killings can become lengthy and highly complex. In some situations, separate investigative bodies may reach different conclusions regarding whether an officer’s actions complied with applicable laws, policies, or constitutional requirements.
2026 vs. 2025: Is This Year Better or Worse?
From Jan. 1 to March 19, 2025, there were 289 police killings recorded, compared to 270 over the same period in 2026. This represents a decrease of approximately 6.6%.
However, the pace of police killings in 2026 so far is much higher than it was overall in 2025.
If the average number of killings per day recorded so far in 2026 stays consistent through the end of the year, the total number of killings could still exceed 2025’s full-year total of 1,197.
Why Understanding Your Rights During Police Encounters Matters
Police encounters can become stressful and unpredictable very quickly, particularly during traffic stops, criminal investigations, or situations involving alleged weapons, suspected drug activity, or other high-pressure circumstances. Understanding how to respond during these interactions may help reduce the risk of escalation and protect an individual’s legal rights if an investigation develops further.
In many situations, officers are required to make rapid decisions while evaluating safety concerns, potential threats, and the information available to them at the scene. At the same time, individuals involved in police encounters may not fully understand their legal rights or how certain actions or statements could later affect a criminal investigation.
During police encounters, individuals should generally understand:
- The right to remain silent and avoid making potentially incriminating statements
- The importance of remaining calm and avoiding physical resistance during an encounter
- That officers may rely on statements, observed behavior, and other evidence gathered during the interaction
- The right to request legal counsel if detained or subjected to questioning
- That actions taken during a police encounter may later become part of a criminal investigation or court proceeding
Because police encounters can escalate rapidly under certain circumstances, understanding both legal rights and the importance of de-escalation can play a significant role in how an interaction unfolds and how a case may later be evaluated by investigators, prosecutors, or defense attorneys.
Why This Data Matters
Each of these figures represents a life lost and a set of circumstances that may have escalated in a matter of moments. While the data highlights broader patterns, it also reflects the reality that police encounters can quickly become unpredictable, especially in situations involving alleged weapons, suspected drug activity, or other high-pressure conditions.
Many of these incidents begin with underlying allegations such as drug possession or weapons-related charges, and the stakes can rise quickly depending on how an encounter unfolds.
Understanding how often these situations occur — and how serious the outcomes can be — underscores the importance of being informed and prepared. To learn more about your rights or to speak with a defense attorney about a specific situation, contact a lawyer at our firm today.
Sources:
- https://mappingpoliceviolence.us/
- https://www.census.gov/data/tables/time-series/demo/popest/2020s-state-total.html
- https://www.census.gov/data/tables/time-series/demo/popest/2020s-national-detail.html
- https://www.govinfo.gov/app/details/USREPORTS-490/USREPORTS-490-386
- https://www.justice.gov/jm/1-16000-department-justice-policy-use-force
- https://nij.ojp.gov/topics/articles/overview-police-use-force
- https://nij.ojp.gov/topics/articles/body-worn-cameras-what-evidence-tells-us
Use the following embed code to post this infographic on your website:
This page was last updated by Brian Joslyn